Context
At CMU, both Bachelors and Master Human-Computer Interaction students work on capstone projects to close out their education. They are the exact same with the exception that the bachelor version is a semester shorter.
The Capstone project is structured to cover the end-to-end design process of a product development lifecycle. HCI students work in teams of 4-6 students with companies ranging from nimble startups to globally recognized brands.
Working with faculty mentors and their industry partners, teams produce user research, product designs and interactive prototypes to improve or design new applications to a partner's existing technology. The project culminates with a presentation of the teams' final prototypes at the end of the summer.
Typically, students with complementary skillsets are chosen to work together. Think: a computer scientist, a designer, a psychologist, and an artist. Our group had three software people, an artist, and a psychologist. I decided to leave the software work to the other two computer people and work with the psychologist on UX interviewing, persona creation, and mapping out processes.
About Platypus LLC
Our client for this capstone was Platypus LLC, a local Pittsburgh startup. At the time, they produced small hover boats equipped with Android phones that autonomously travel across bodies of water. While traversing a body of water, the boats test samples of water for pH level and common contaminants, and create a map of the water for the owner of the boat to review.
Fracking is a large concern in the part of the United States that Platypus is located (near the Appalachians), so the product was created with reporting results in mind. The "heat map" graphic is useful to identify from where a contaminant might be emitting from to help identify fracking leaks.
When we first met with Platypus, they already had the hardware and the graphic making ability, but their reports were printed and mailed by snail mail at the end of the month. A month can be a long time, especially given it can take a matter of a few short days for a body of water to be completely contaminated. They wanted us to investigate whether investing resources into making a live web dashboard was worth it, and to make a prototype if we found it was.
Interviewing
In order to investigate on behalf of Platypus, we had to find potential Platypus users to interview. We had a lot of questions given that none of us were from the Appalachians or the agricultural industry.
Some of our asks of agricultural workers were:
- How tech-savvy are they? Do they have reliable internet? Would they look at a dashboard frequently?
- How knowledgable are they about fracking? Is fracking a known quantity in their area?
- How dangerous is fracking contamination to their business? Would a contamination have a huge effect on their crops/timber/etc?
Platypus was still early in development, so they didn't have too many resources for us to lean on, so we had to get creative:
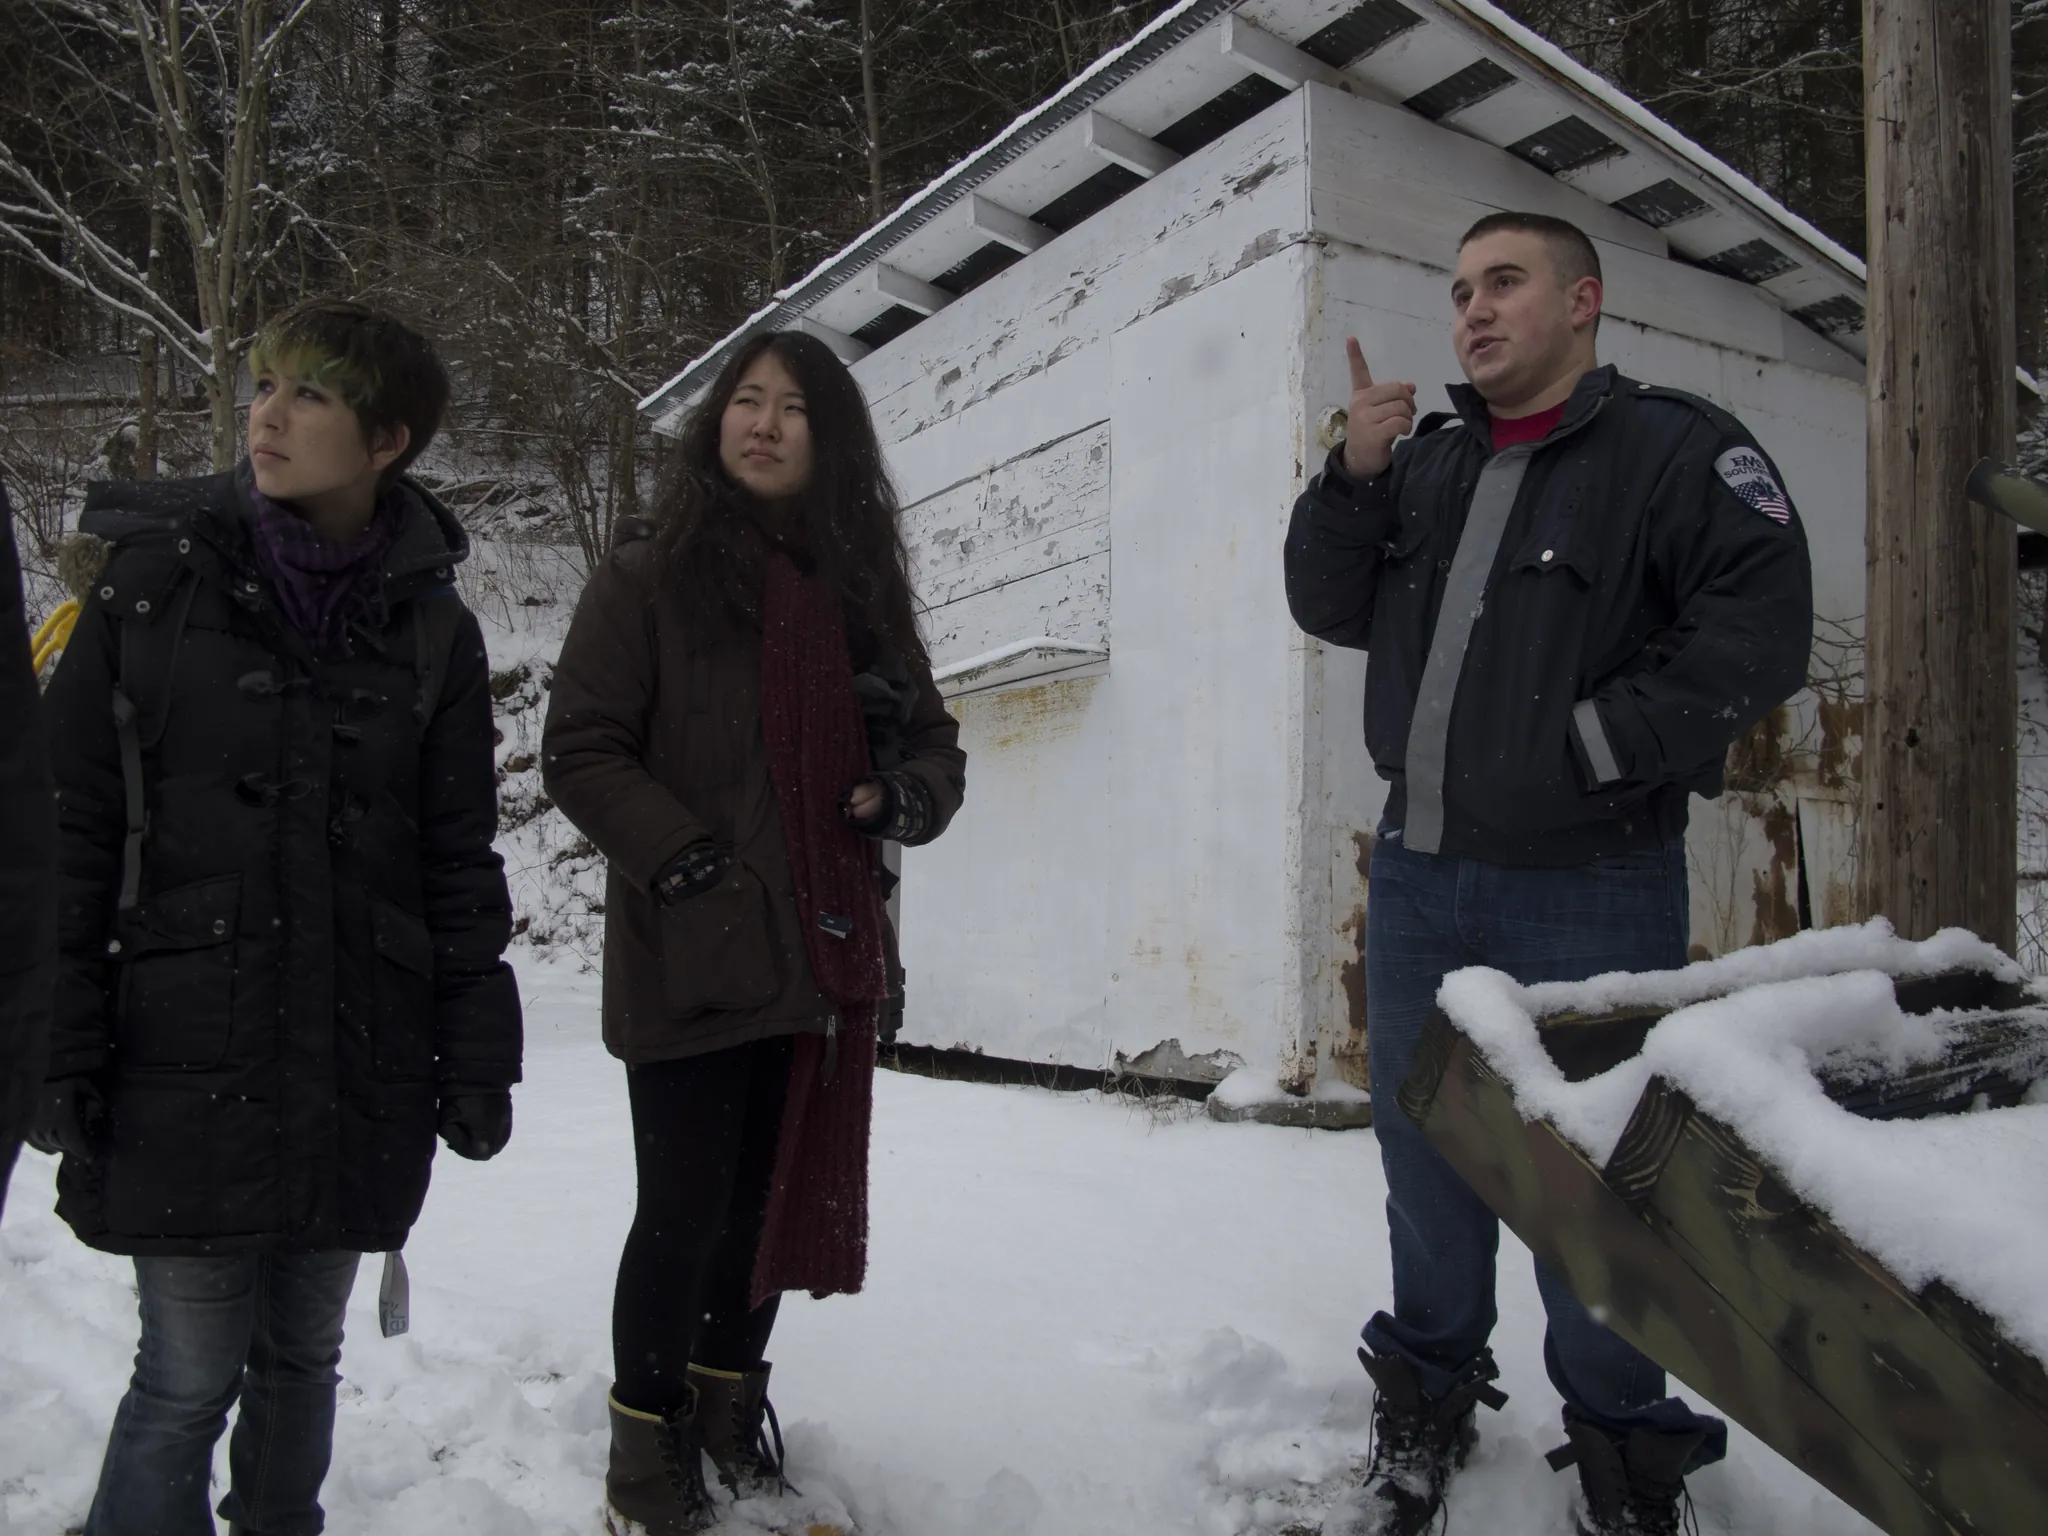
- I asked a Pittsburgh police officer if he knew anyone and he pointed us to a timberer that lives in Beaver County, PA. We drove through 2 feet of snow to visit him and interview him.
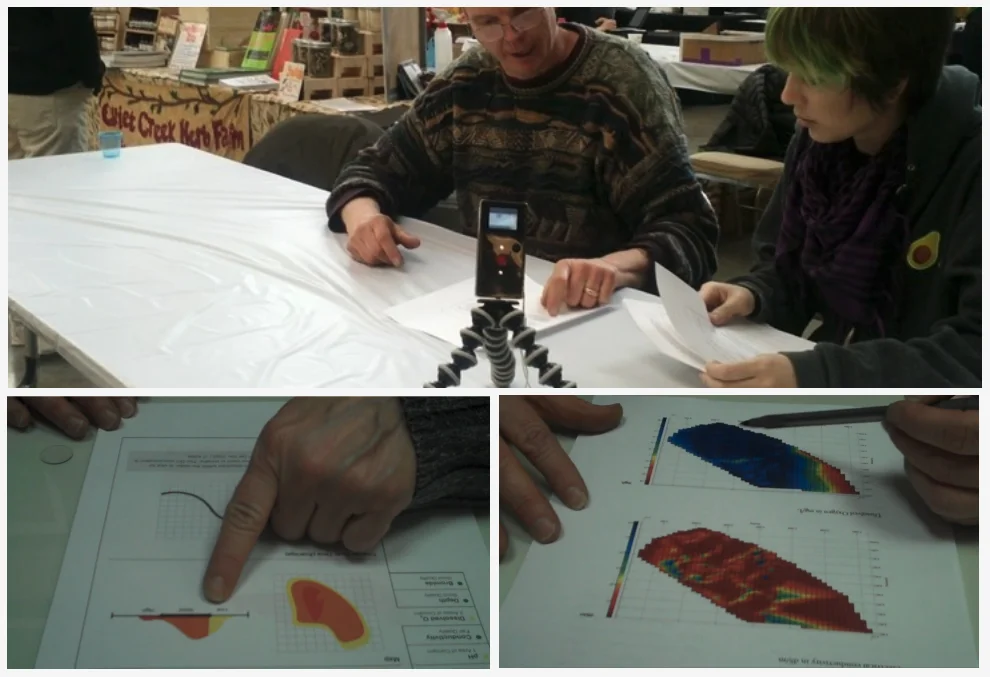
- My teammate Soyeon and I went to the Carnegie Science Center and found a hydrologist to test our low-fi mockups on.
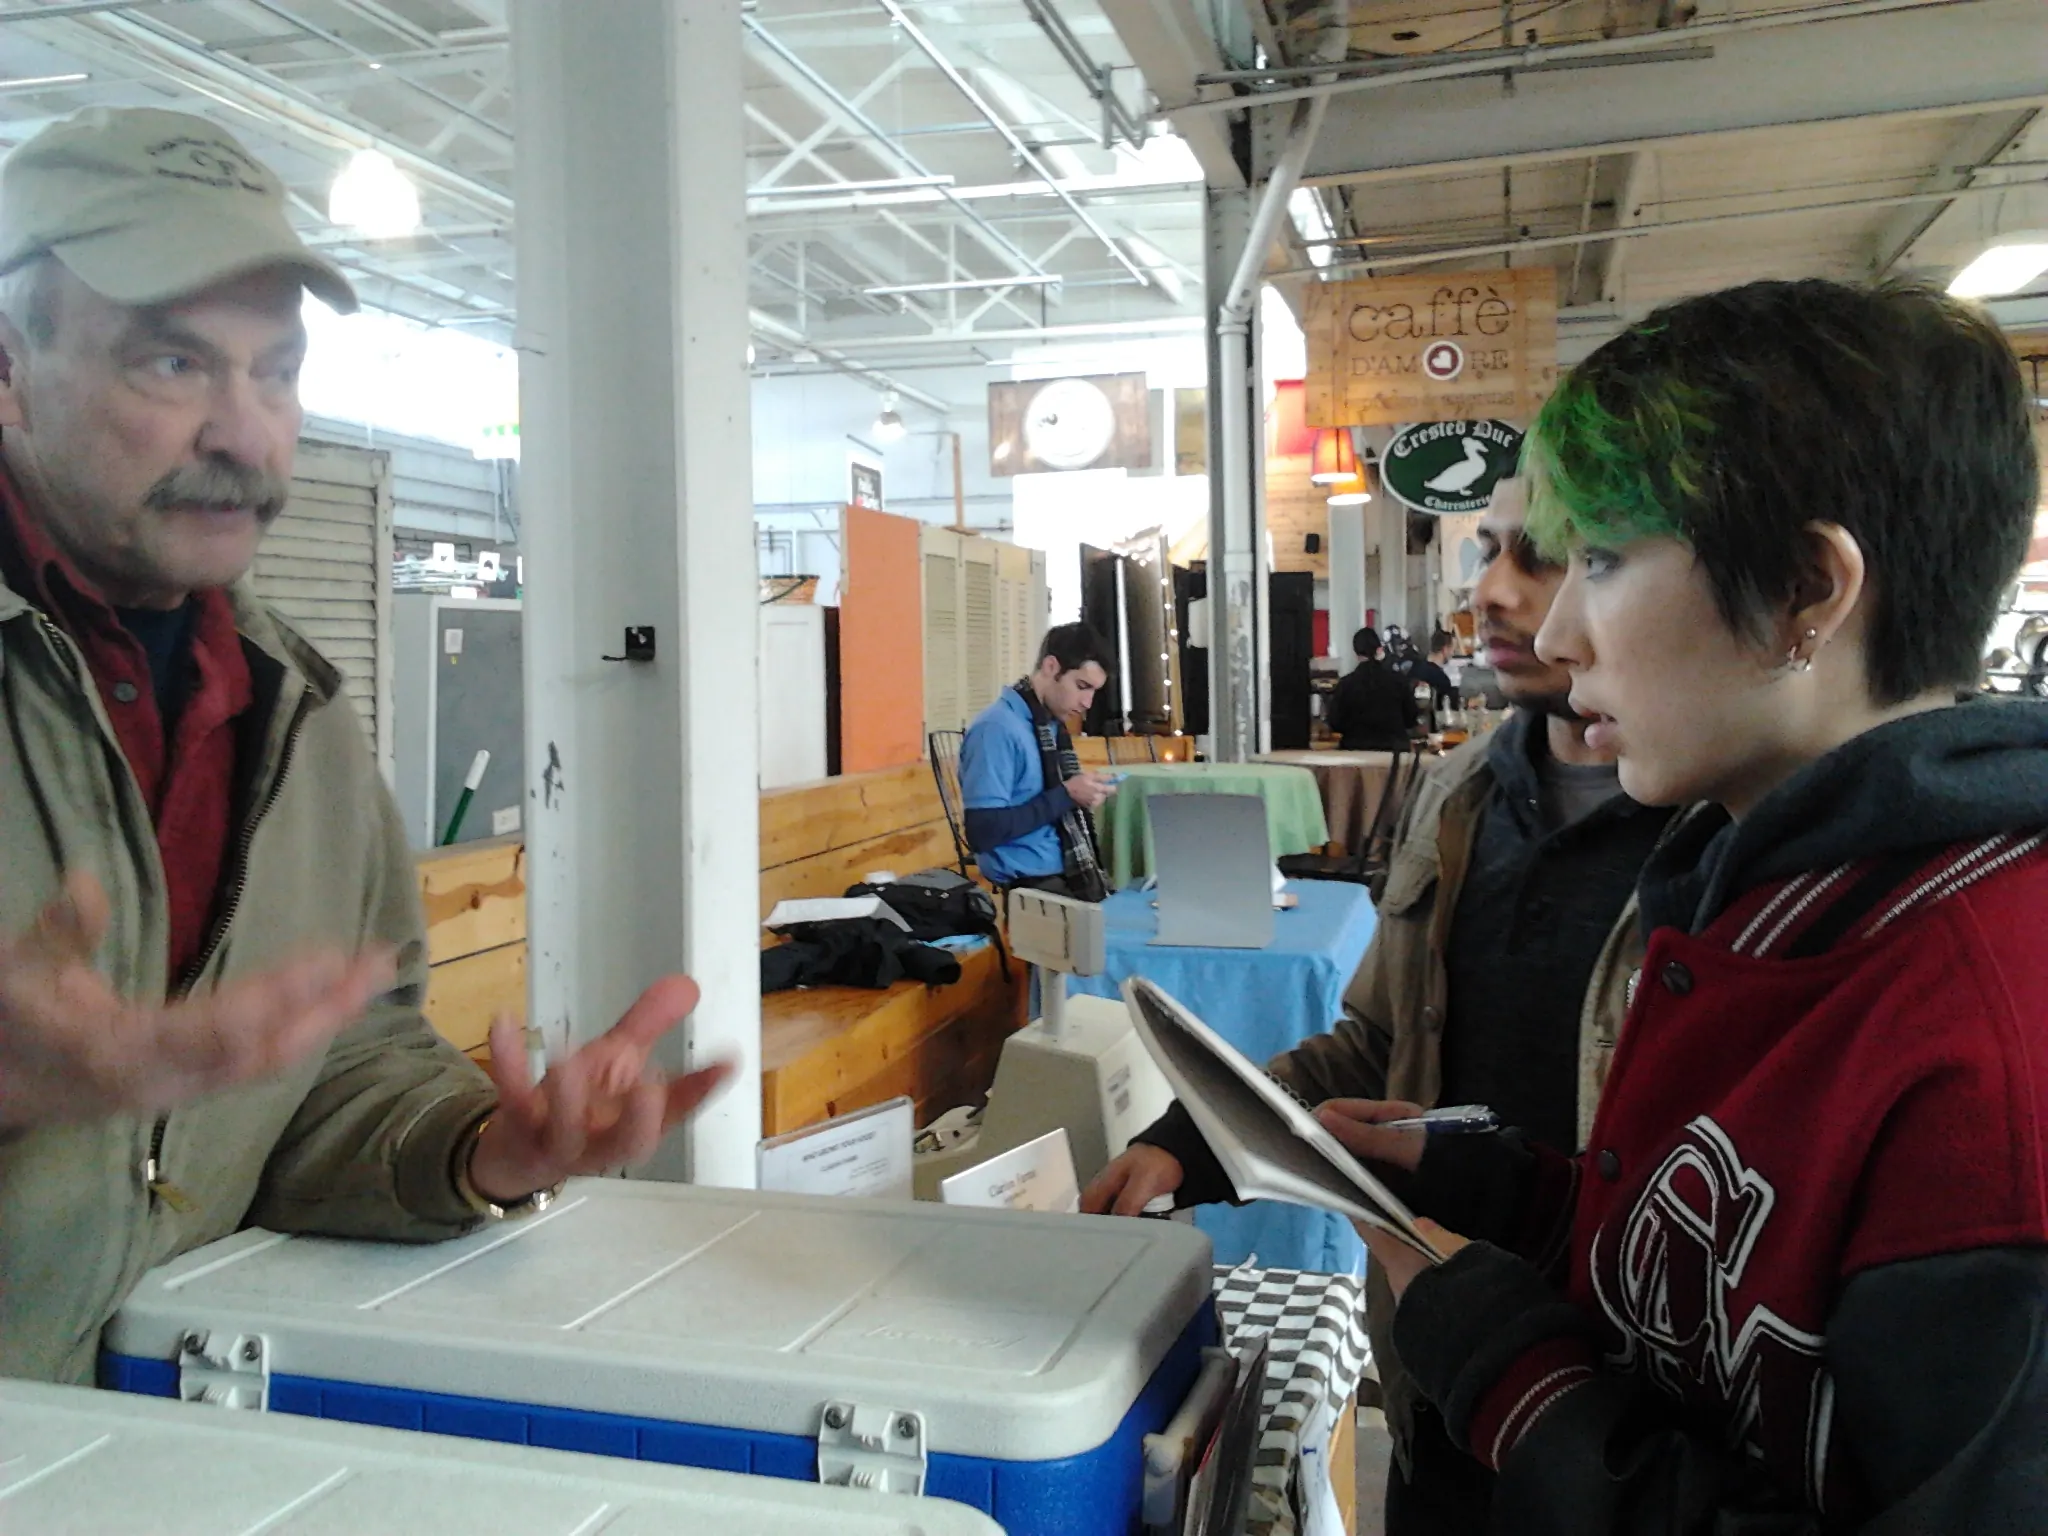
- We all went to the Strip District Farmer's Market and found several farmers/ranchers
- We grabbed some professors and students to run through paper and low-fidelity mockups with us after having interviewed the rest
My role
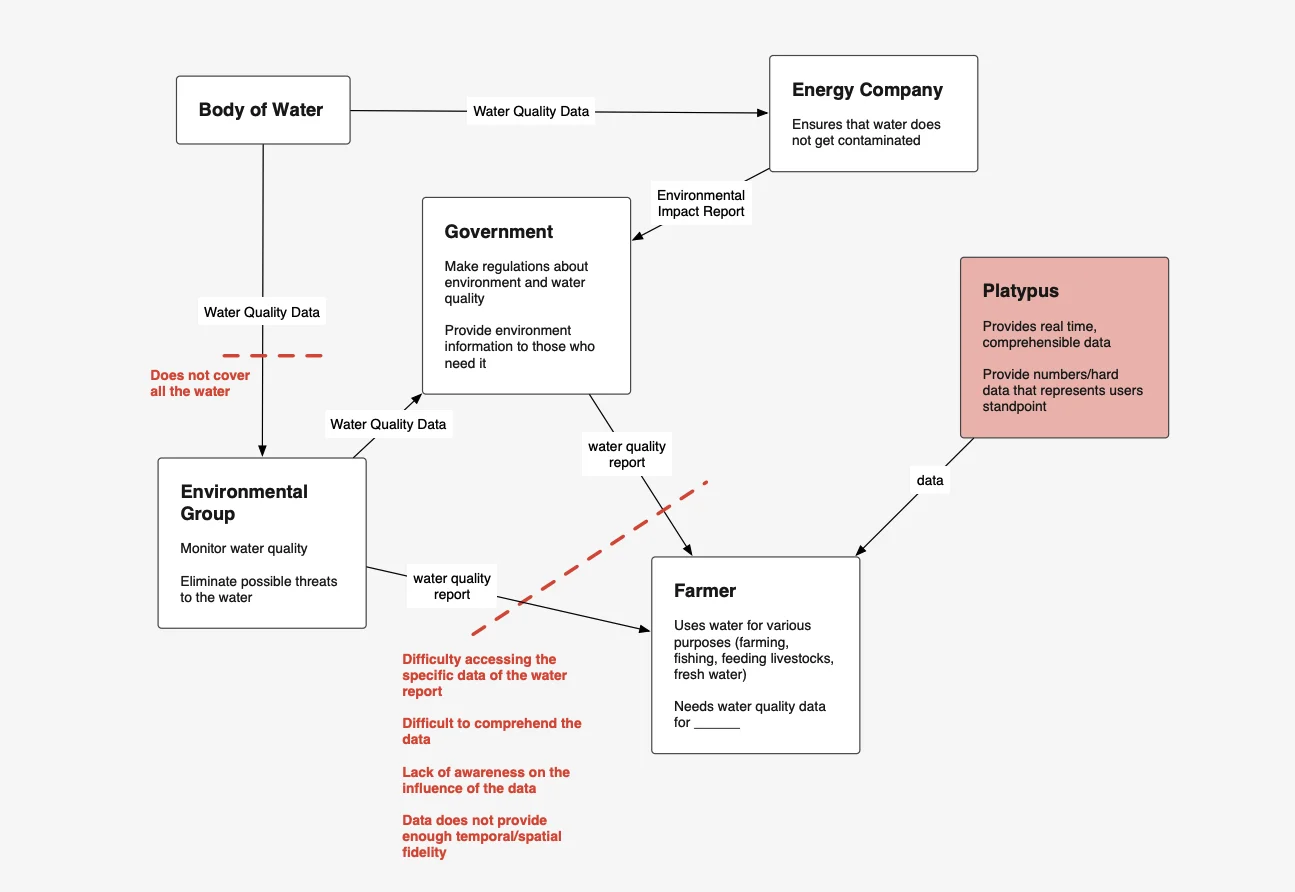
I found most of our interviewees and ran the vast majority of our contextual design interviews. I provided design feedback to my teammate Alex Rothera on his product mocks, and took his mocks into the world to gather feedback for the next iteration. I also produced a lot of the visualizations in our final presentation and report, such as the informational flow chart and the people interviewed visualization. Lastly, I did a lot of project management. I maintained the Gantt chart and scheduling, which was a natural step because a lot had to be scheduled around when user feedback would come back.
Process pictures
Through a friend of a friend, I found a timberer who was willing to take part in our UX research. We drove through the February snow in Pennsylvania down to Beaver County to see his day-to-day operations. While there we inquired about his knowledge of the dangers of fracking and whether his timbering operation would be interested in beta-testing the Platypus water monitoring system. Pictured here is myself and my teammate Soyeon Hwang interviewing the timberer
Identifying the entities involved, the flow of information, and where the breakdowns are in that flow
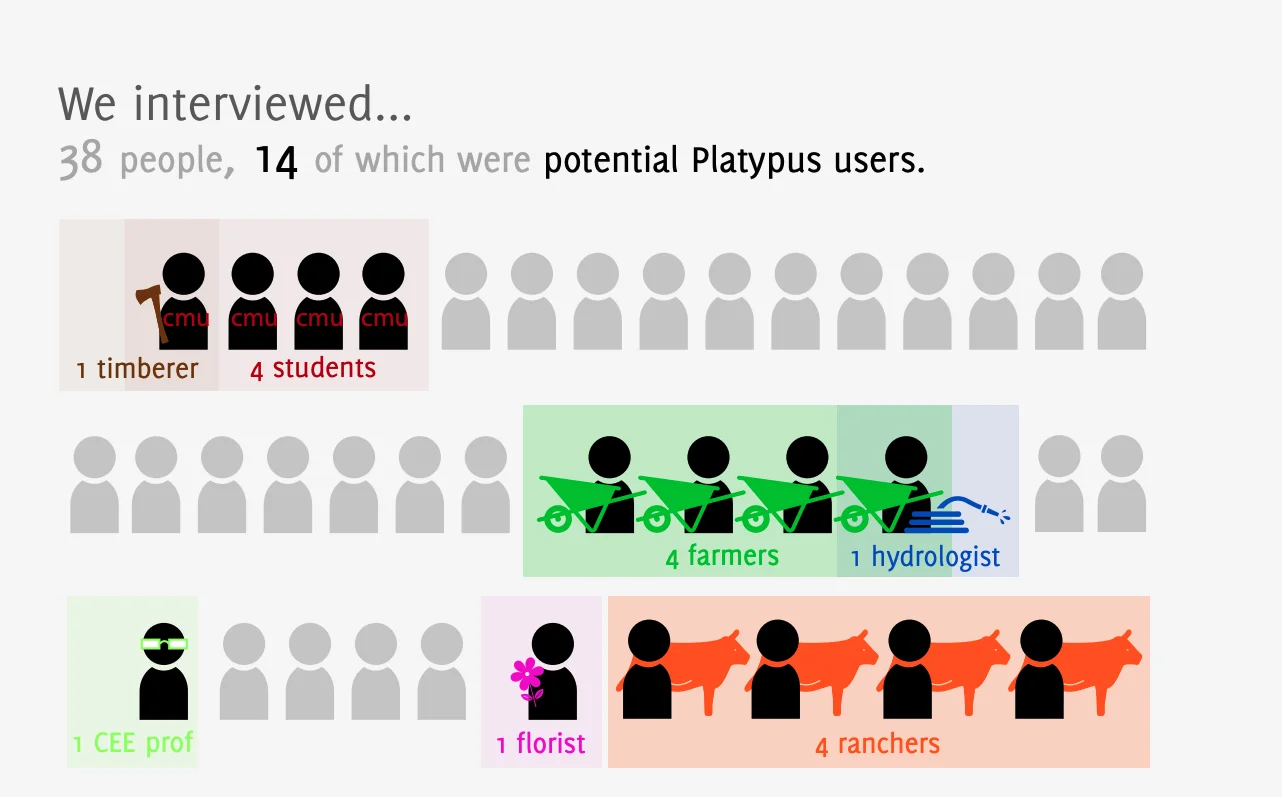
Who we interviewed to both understand the agricultural space better but also to test the ease of our UX in our mockups.
Final recommendations and presentation
As part of our capstone, we made a presentation of work done for Platypus LLC to be presented to the rest of our class as part of our capstone, and includes a lot of context as to who the client is and what they are trying to accomplish. A much more generalized version of the final report we gifted the client intended for a much broader audience. The information is more focused on UX techniques used, including contextual inquiry and persona creation, and less on business recommendations. The first document on this web page is this presentation.
In addition to the presentation, we created a final recommendations report of our UX findings and gave it to our client, Platypus LLC. It covered the exploration for how we designed our medium-fidelity prototype we created and how different identified personas would use that prototype. Also explains the breakdowns we found in their existing product and user feedback on our iterations on their product.