For ITP's Playful Communication of Serious Research class, we had to craft an interactive experience befit for a museum that presents specific research from NYU to a broader audience.
After reading many research papers out of NYU, we chose the paper Children's social representations of utopian societies by John T. Jost and André A. Fenton.
The Research
The paper follows 56 elementary-school aged students from Hunter College High School. The children read Lois Lowry's book The Giver before teaming up in groups of 4-5 to come up with ‘two major problems in the current society and a plan for how their utopia will eliminate these problems’.
To give them inspiration, they are taught about the UN's 17 Sustainable Development Goals and use it as a basis for creating their new societies. The children have to name their new societies, come up with a flag, and a small constitution outlining how they will address these two major problems.
Schools are sort of microcosms of our society, and there are a lot of concerns among young people about what the future looks like. It is not only interesting to let them think about possible solutions for the future but also for adults to learn from their answers and see how the future generations view the world.
We loved these aspects of the research and thought it lended itself well to an interactive experience. Just as the school challenged the children to think of and identify just two major problems in society worth solving, we thought it would be engaging to pose the same questions with some of the same material to showcase goers.
Brainstorming
Our stated goal for our project was to introduce the concept of the research (comparing children’s “ideal sociality” to the UN standards of Utopia sociality) and briefly explain the history of utopia sociality, and collecting and displaying input from the visitors.
Though the research was with chlidren, our intended audience for our experience was for both children and adults. Since we are gathering input from the viewers, we wish for a more diverse crowd.
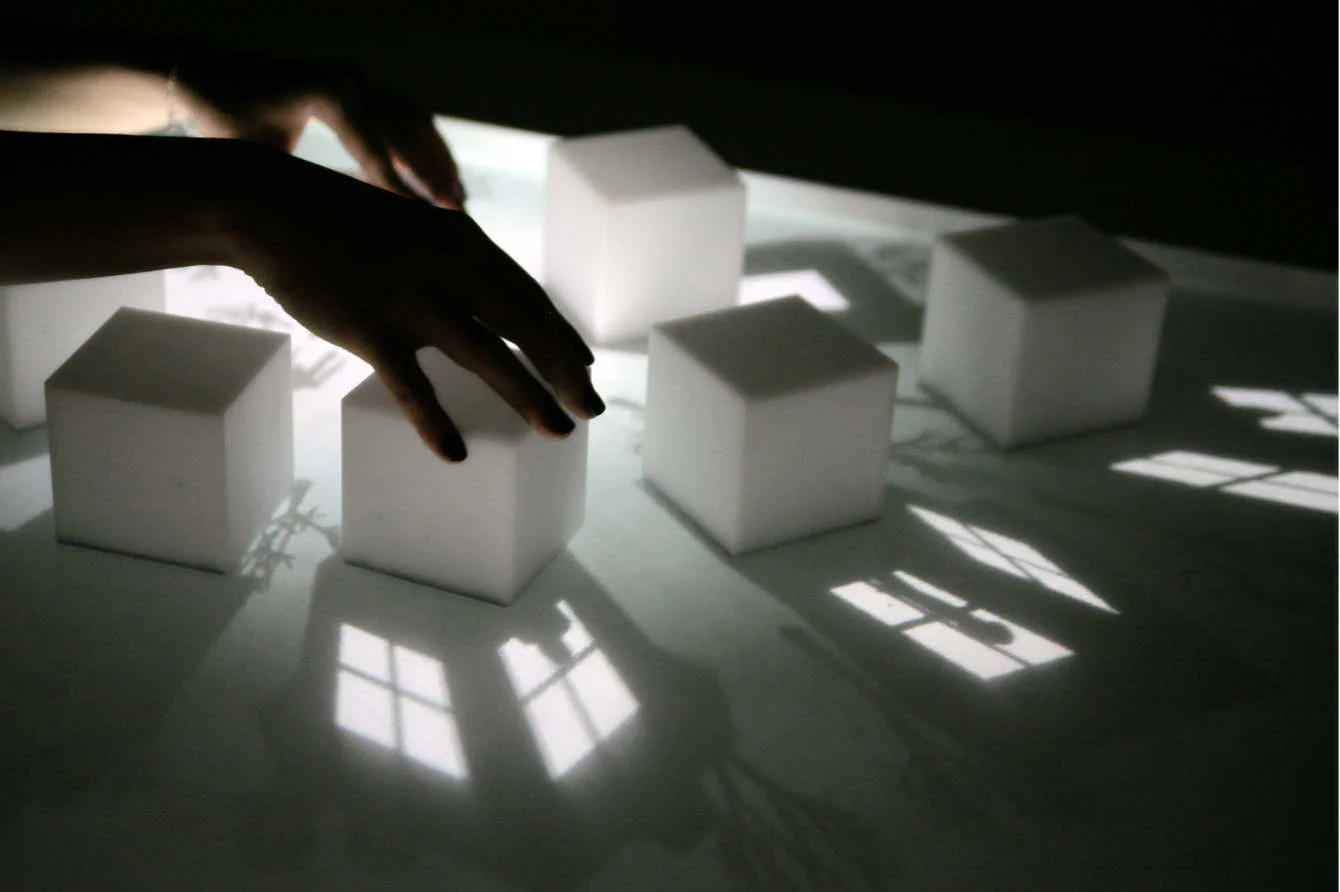
For each idea we did a small sketch and gathered inspiration images from other projects.
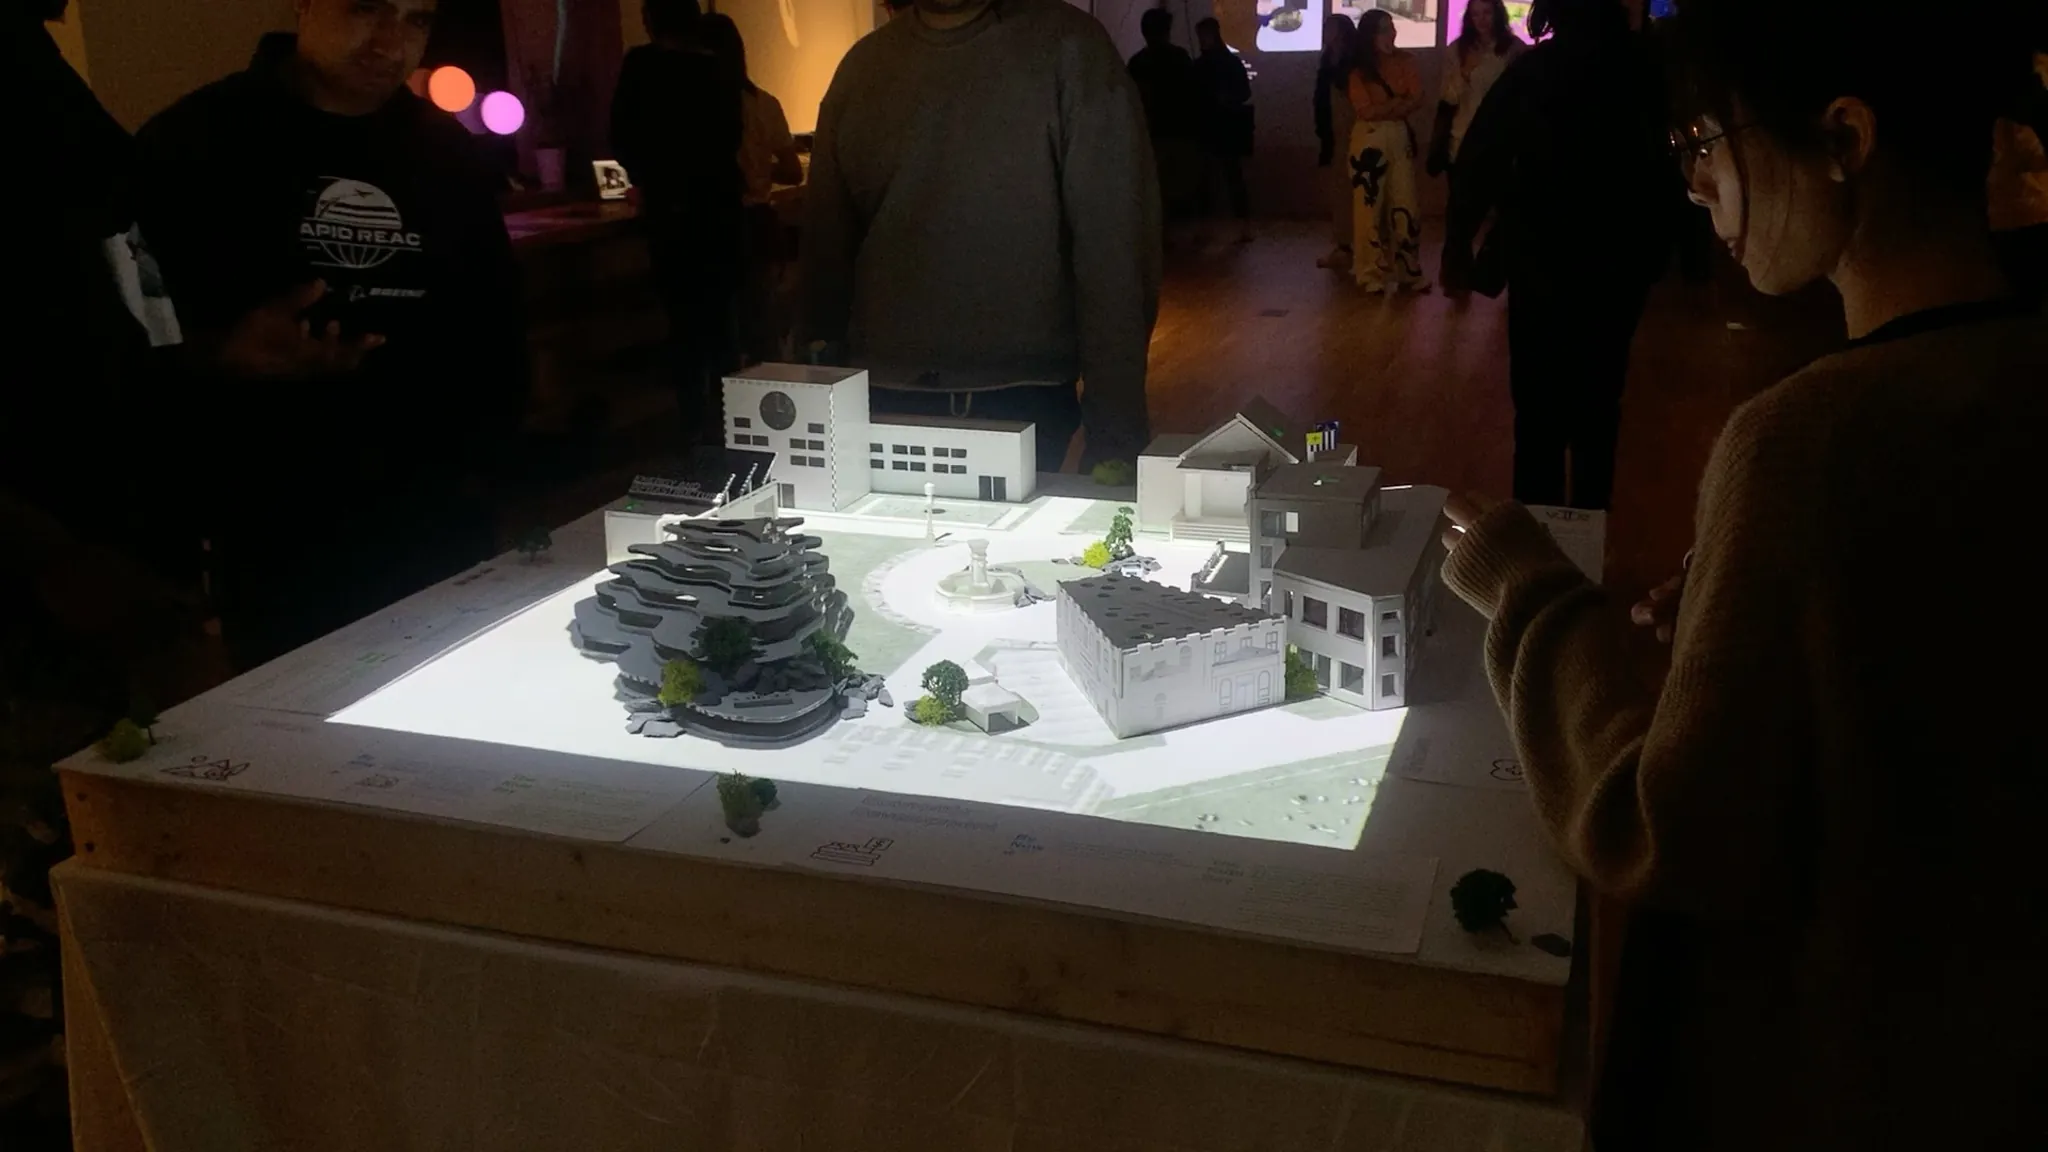
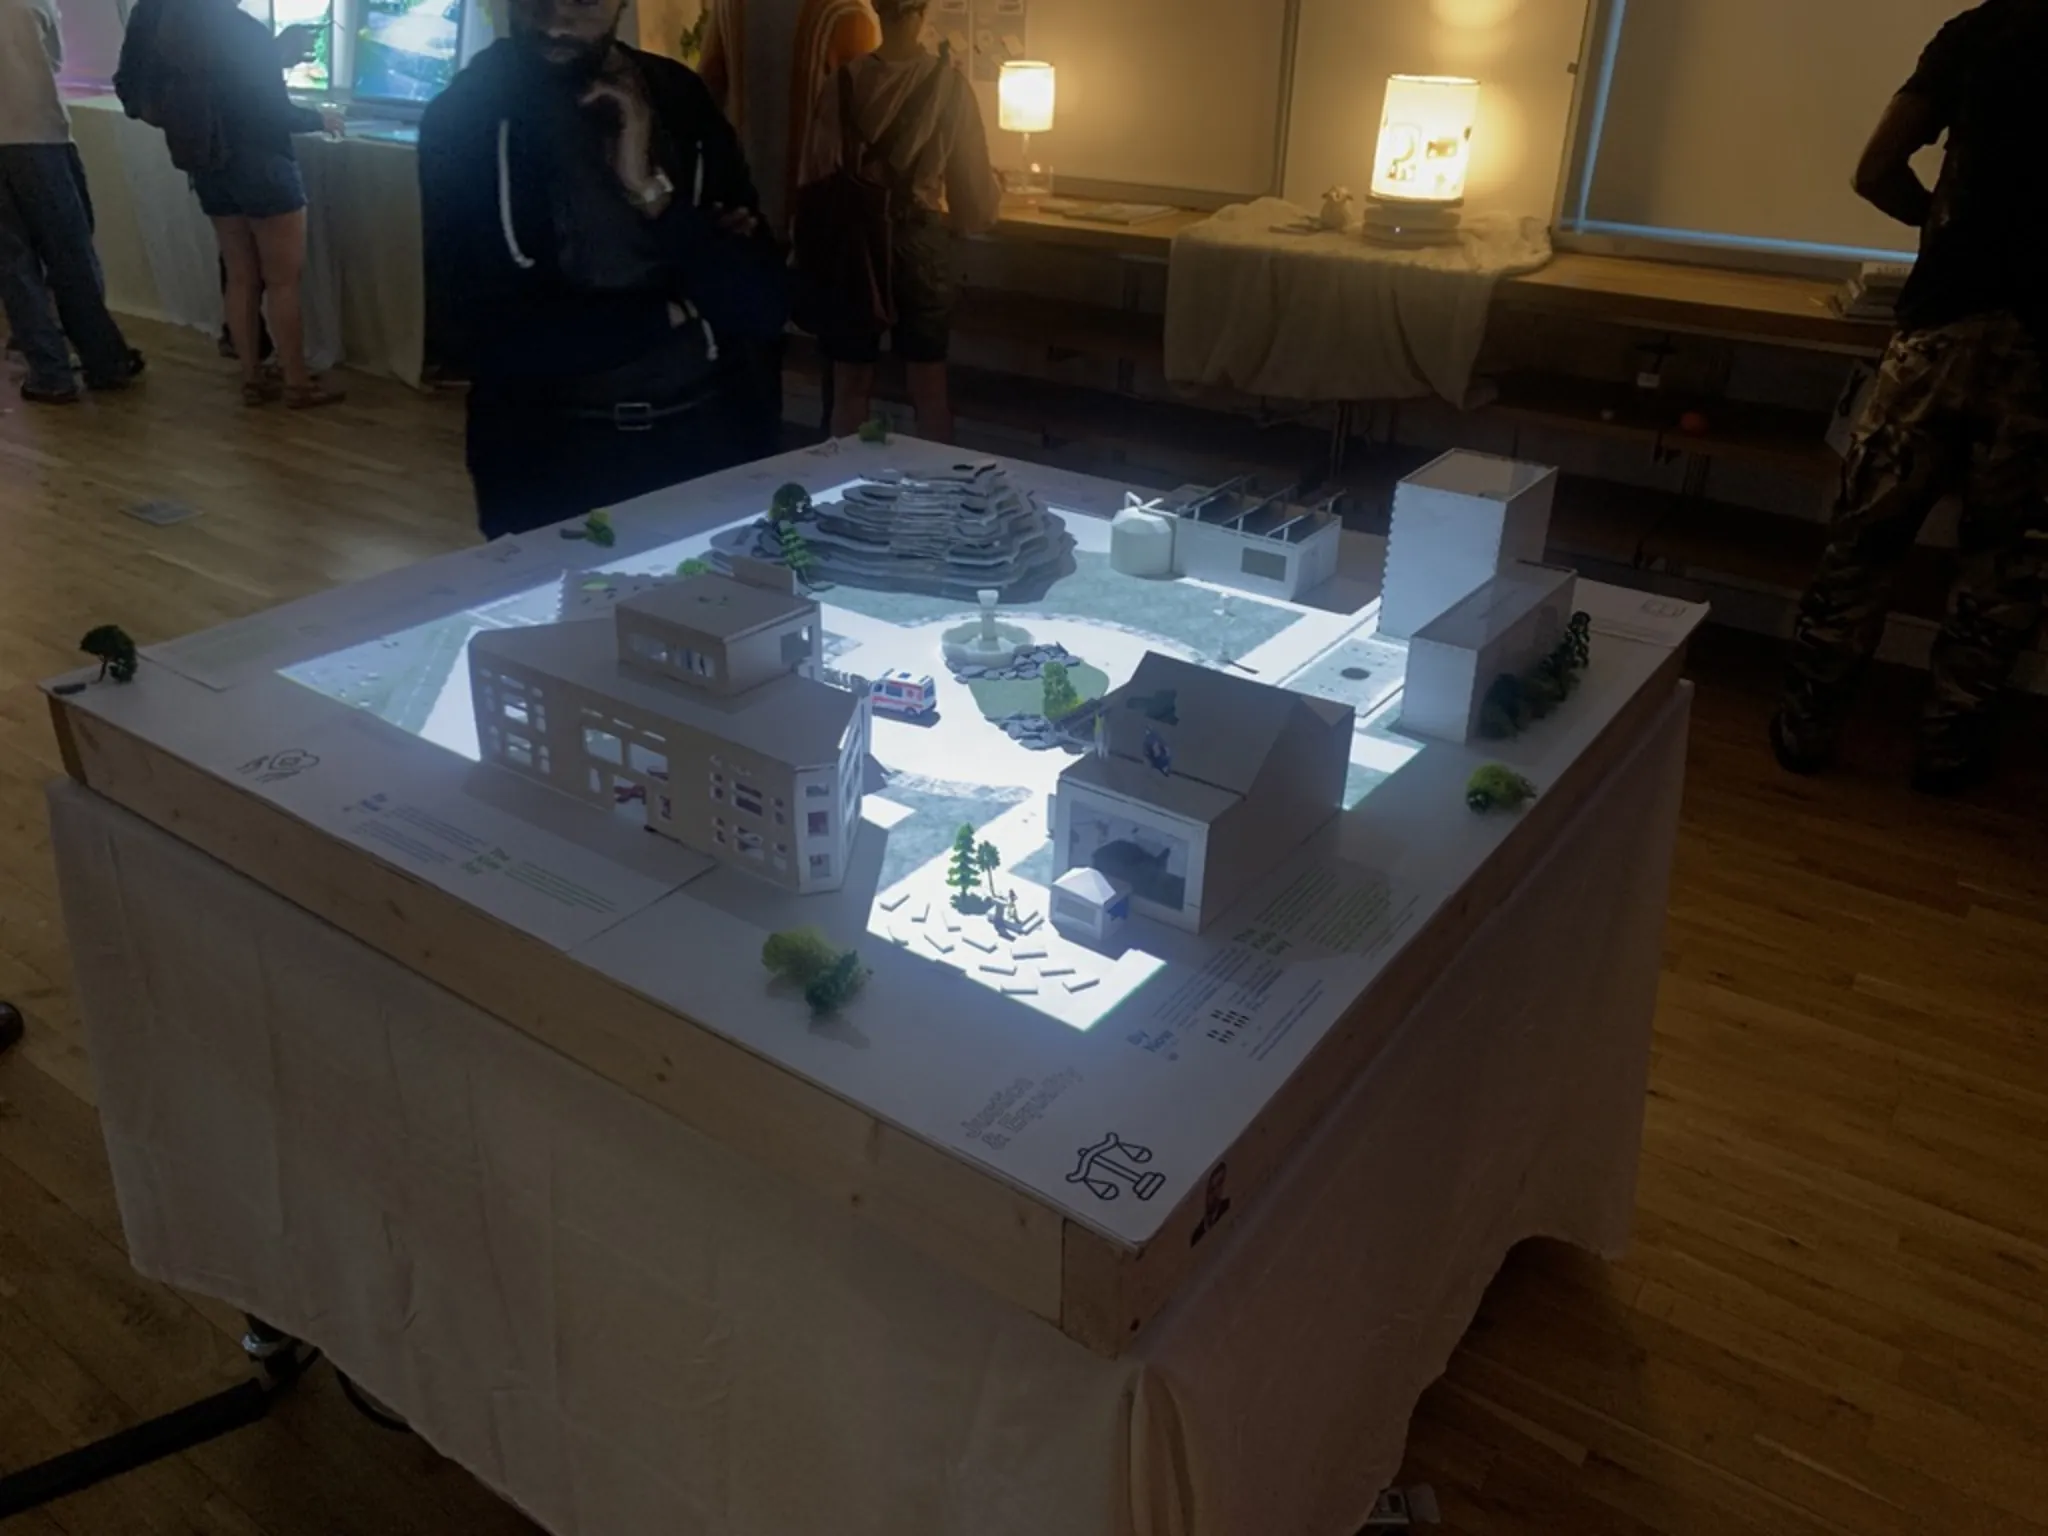
Idea #1: Interactive City Projection Table
Projection mapping on city block models that changes in real time to reflect audience’s votes and visualize a utopia co-created by the audience as a whole
This idea takes cues from dotmocracy, which visualizes opinions & data gathered from the audience via dots on a canvas. The different areas of the city would correspond to UN’s 17 Sustainable Development Goals, such as a hospital representing health and wellness. The audience votes by putting tokens in corresponding areas based on their priorities of utopia.


Idea #2: AI-Generated City Skyline Mural
Projection mural of an AI generated city skyline in which every viewer responses produces a new block. Each response is an individual exercise with a potential to contribute to the research.
Viewers will walk into a room and see a panning, parallax project mural collage of a cityscape overlayed with descriptions. After answering a few questions on the kiosk, they will see their own utopia come to life and be added to the mural. The mural would be created in realtime with text-to-image AI, likely DALL-E 2 with it's outpainting API.
There would be a little photobooth area to print out or digitally share a postcard of their utopia block. At the end of the experience would be a wall with projected word clouds and visualizations of peoples’ answers so you get a sense of where the majority lies.


Idea #3: Scavenger Hunt
Scavenger hunt that encourages viewers to collaborate by finding different items referencing the research at different stations. The items have RFid tags that changes the black and white interactive mural into a colorful and lively one when brought back, as a nod to The Giver.
The clues would be constructed in a way that should be done in groups, such as giving people different colored gel photography sheets that, when overlayed, show a full picture from a page.
For this idea, we had additional goals. Namely we wanted to introduce the result and concept of the research via an activity that encourages more direct collaborative interaction.


Schematics
Our group as a whole didn't have much programming experience so we ended up wanting to combine both the first and last ideas. Have a projection table with city blocks, but also have a supplemental scavenger hunt.
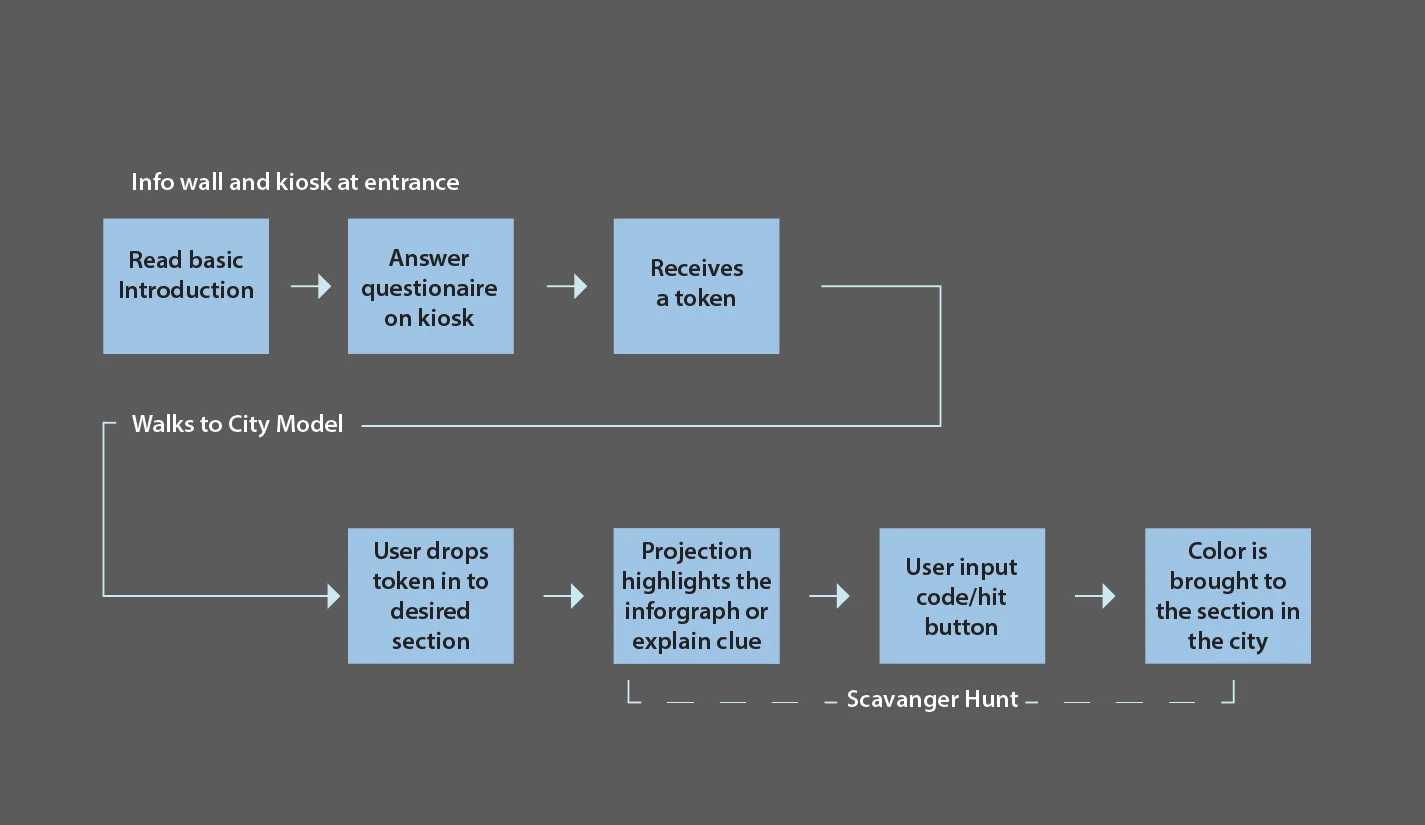
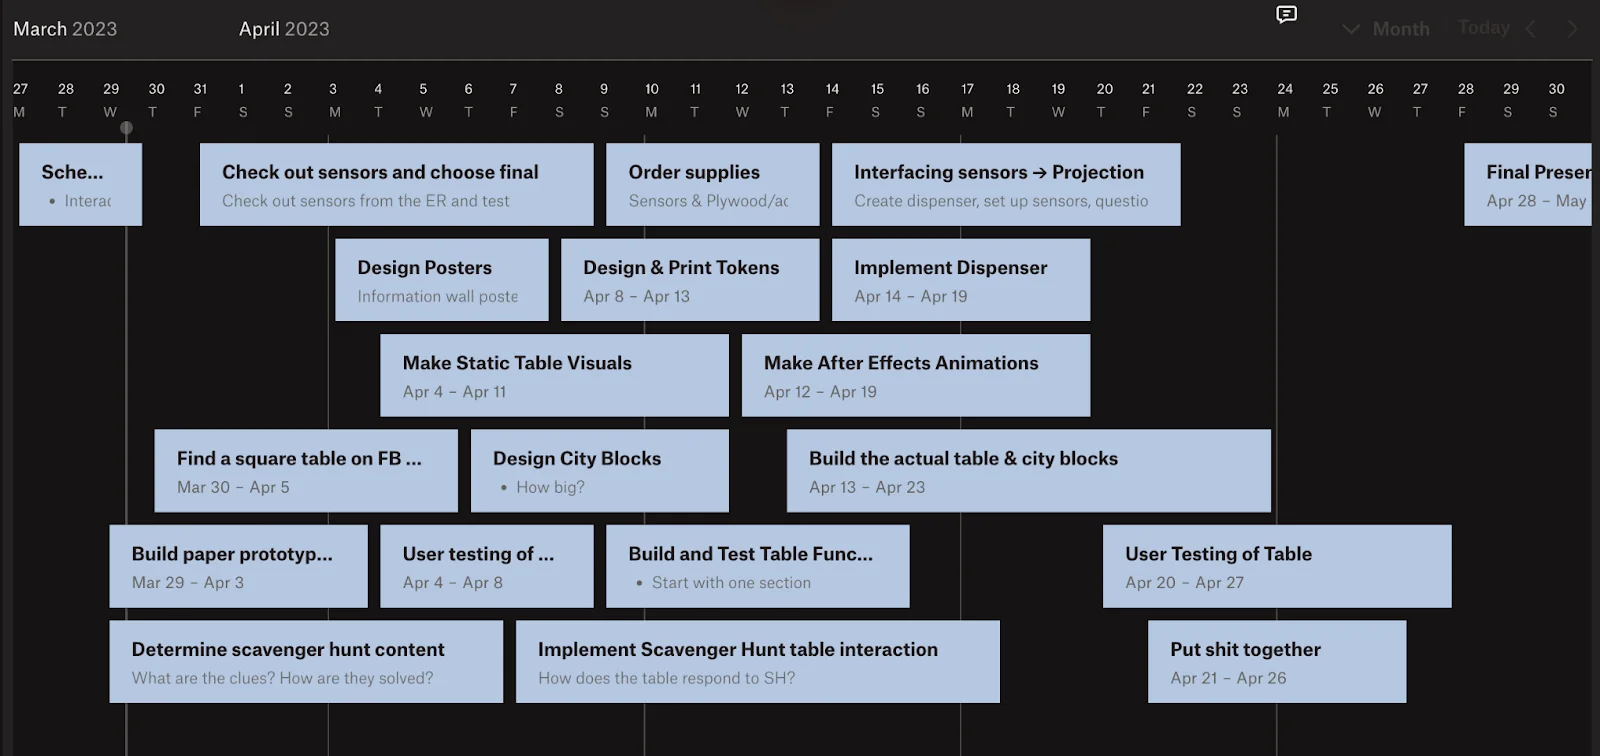
From there we had to create our plan, for both the exact user flow as well as the implementation and execution plan.
User Flow
Originally we wanted people to answer a questionaire at the start of their experience for our own record keeping (and to give the researchers more data to work with), but due to time considerations we axed it.
Implementation plan
This was our final project for the class, so we only had 5 weeks to execute with 5 people.
Design
We decided that 17 UN Sustainable Development Goals is far too many for viewers to learn and vote on, so we decided to bucket them into 6 main categories:
Wellbeing
- No Poverty
- Zero Hunger
- Good Health & Wellbeing
Community Institutions
- Quality Education
- Community Partnerships for Goals
Justice & Equality
- Gender Equality
- Reduced Inequality
- Peace, Justice, & Strong Institutions
Energy & Infrastructure
- Sustainable Cities & Communities
- Clean Water & Sanitation
- Affordable & Clean Energy
Economic Development
- Industry, Innovation, & Infrastructure
- Decent Work & Economic Growth
- Responsible Growth & Consumption
Nature Preservation
- Life on Land
- Life Below Water
- Climate Action
These 6 categories determine the shape of our city. The intention is for viewers to prioritize which 2 of the 6 are the most valuable to them by putting tokens into small districts of the our city that portray these points.
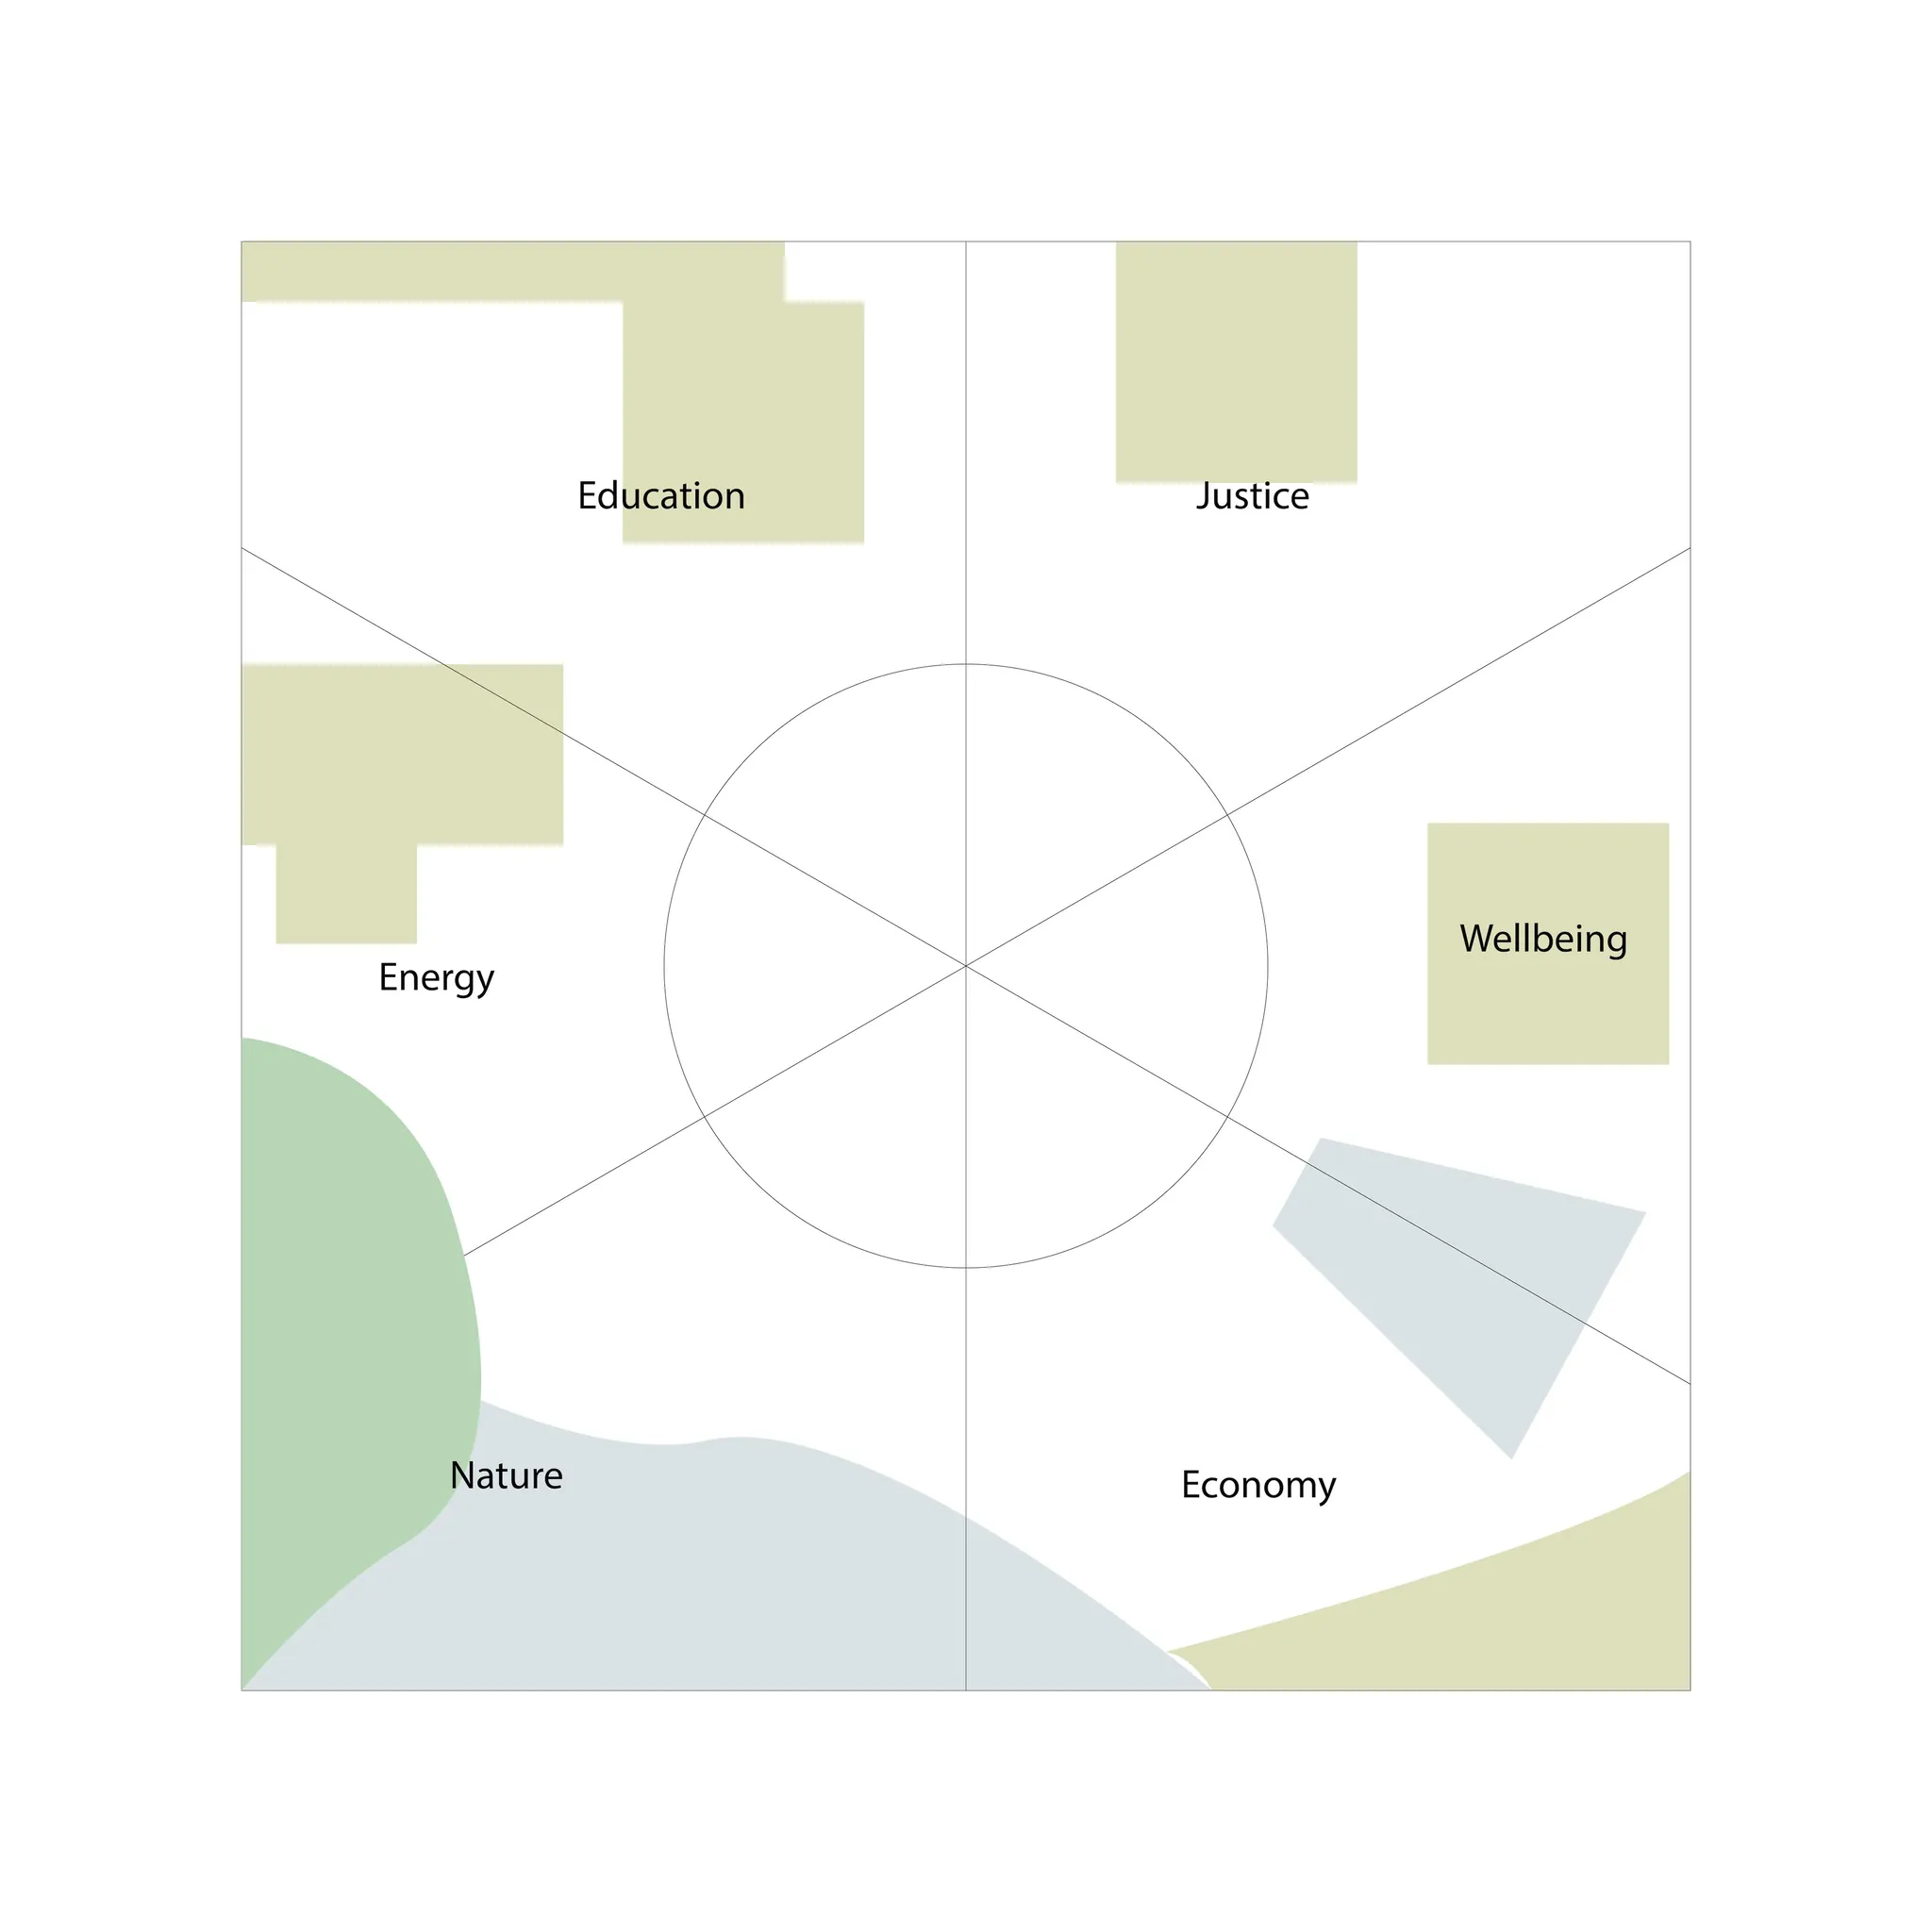
We decided on these districts:
- Hospital for Wellbeing
- School for Community Institutions
- Courthouse for Justice & Equality
- Water treatment plant for Energy & Infrastructure
- Farmer's market and grocery store for Economic Development
- A park of rolling green hills for Nature Preservation
We then planned the layout for our city based on these districts:
Fabrication
This project is obviously very fabrication heavy given that we're physically building a small city, so time to get to work!
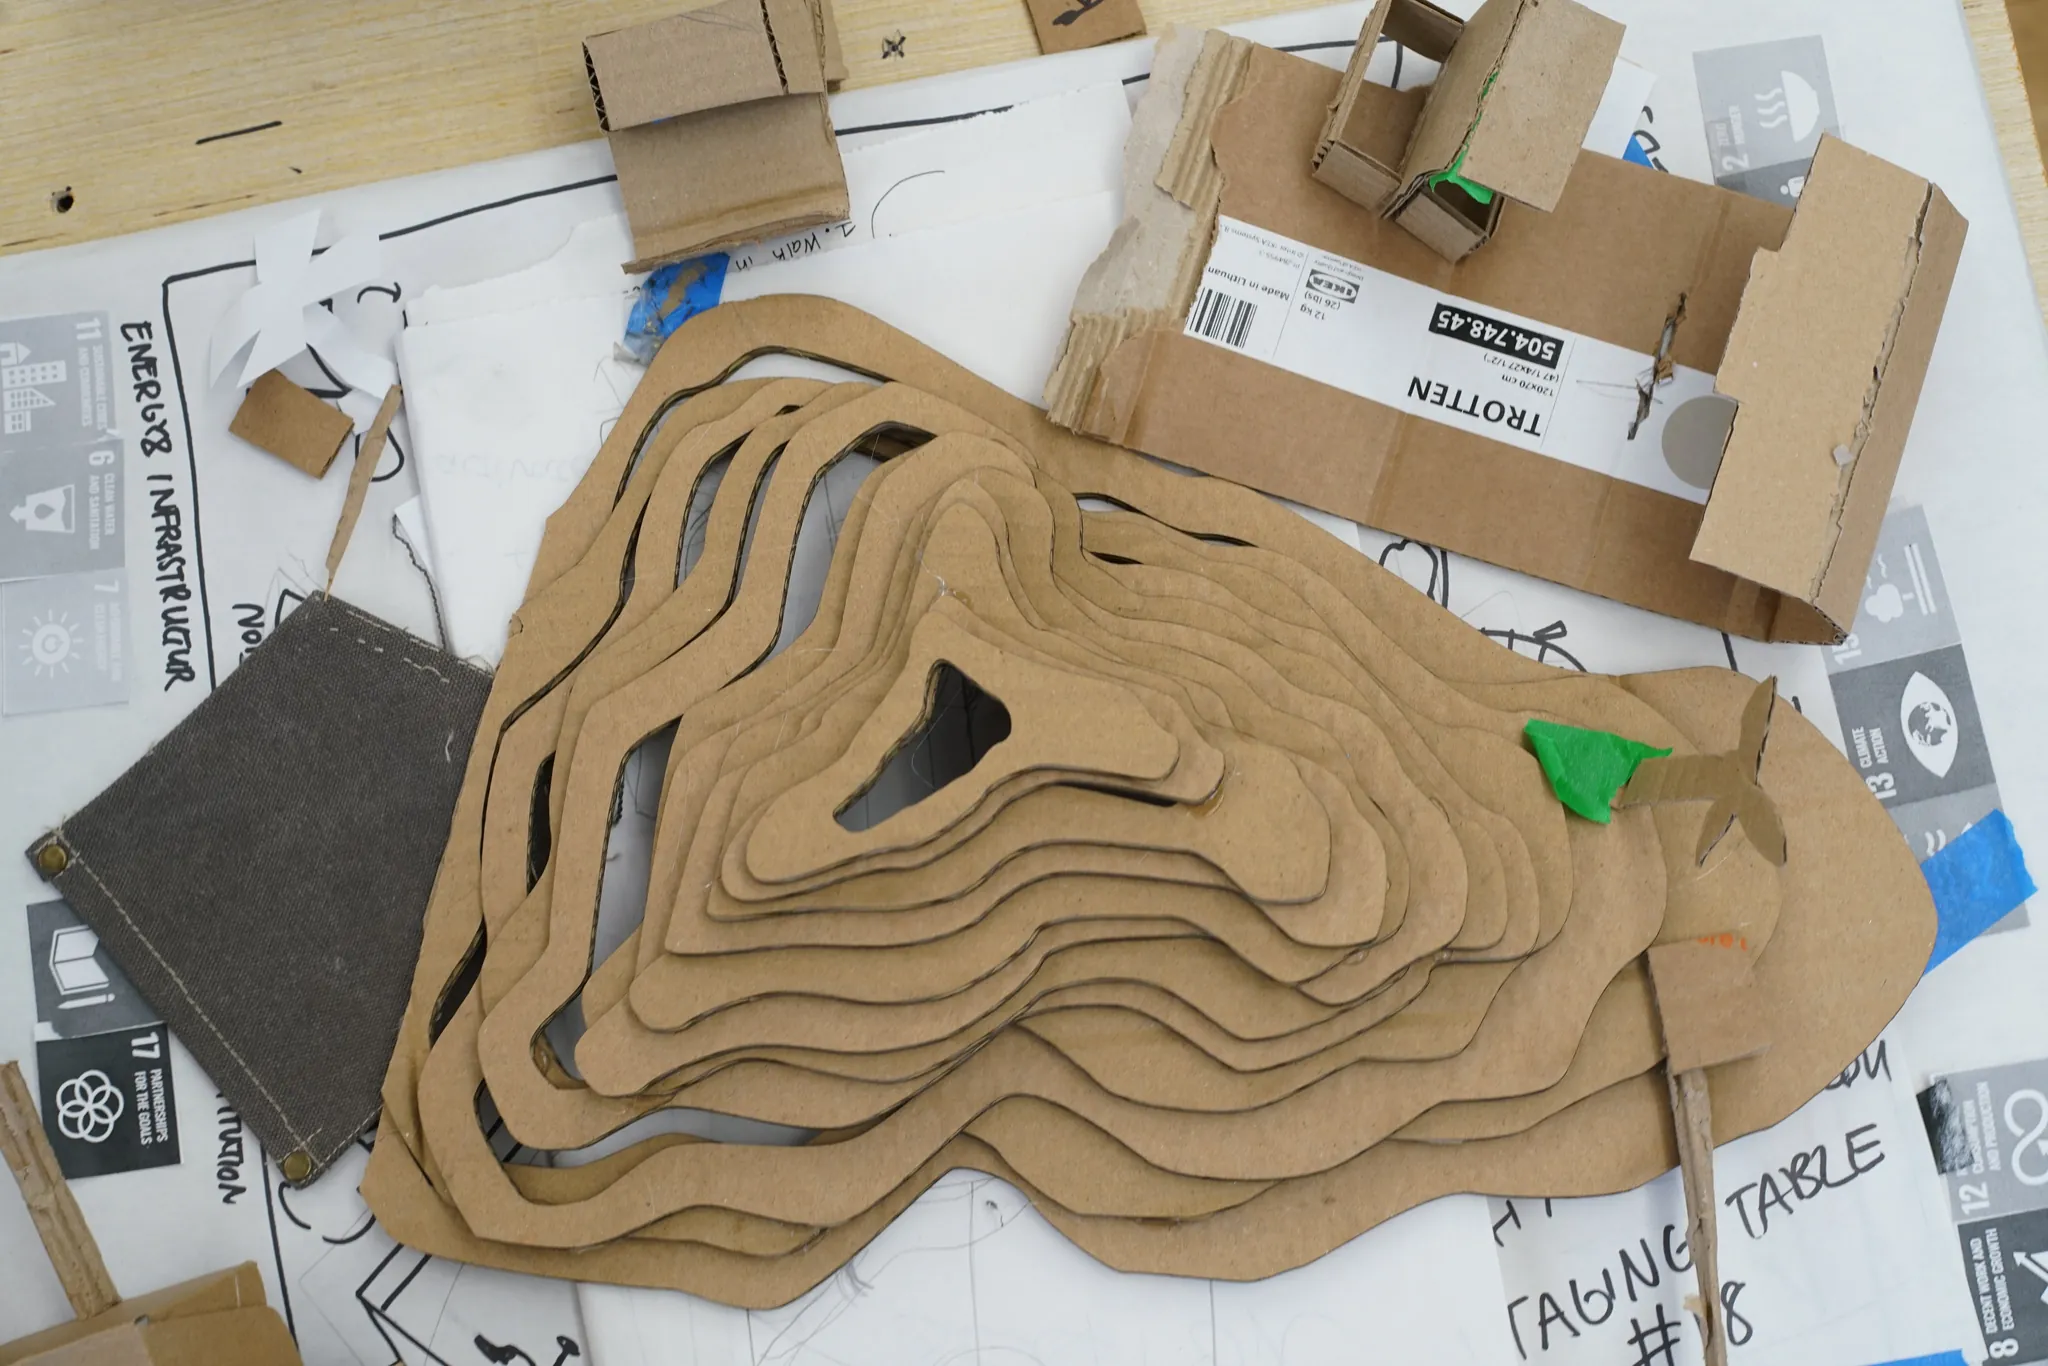
Cardboard prototypes
We started with some cheap cardboard prototypes to ensure we got the sizing and layout right. I was in charge of the wellbeing portion and my cardboard hospital definitely looked like a gospel church.


Our teammate, Bruce, had previous experience with TouchDesigner and while we were fabricating our buildings, he started experimenting with projecting onto the city.
Building the hospital
We each took a different section of the city to work on and I chose wellbeing, aka the hospital.
While my first cardboard prototype was done on the fly just for sizing purposes, the next cardboard prototype and final wood model would be laser cut.
So first thing's first; make the sides of the building in Illustrator, then cut out of wood.


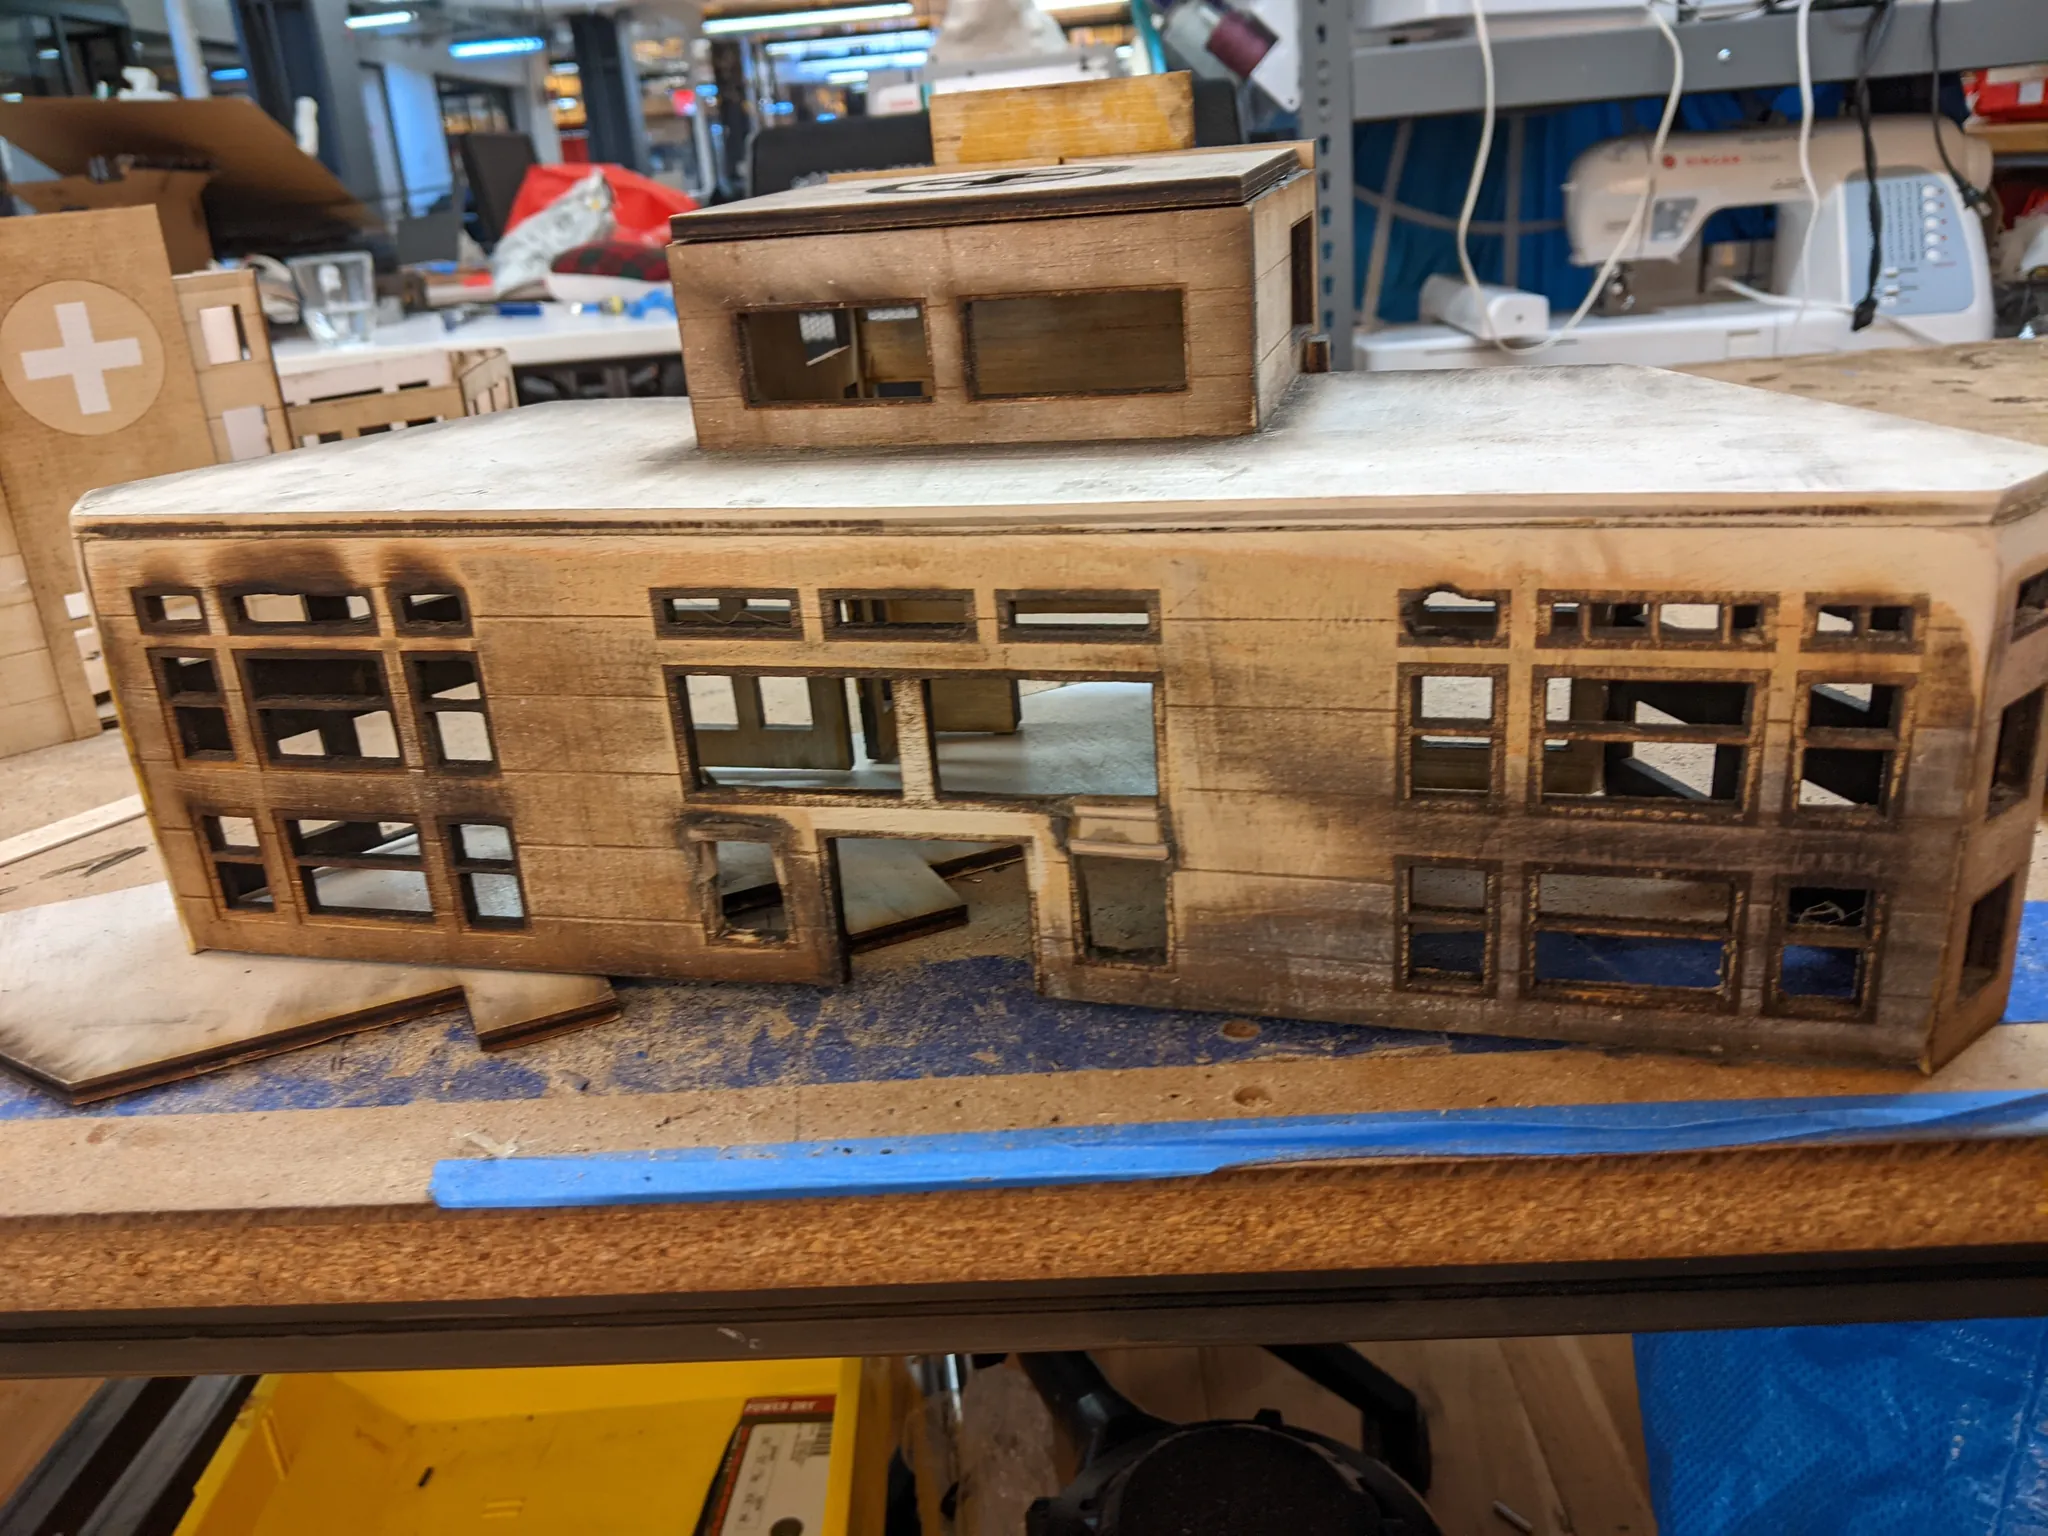
The laser cutter I was using's filter was broken, so the wood caught on fire. Good thing we're painting it all white!
Technical Implementation
Each building must register incoming tokens to collect data but also to provide a reaction in its section (e.g. an animation). We decided to use an Arduino Nano 33 IoT as our microcontroller, but were unsure about what type of sensors to use.
Breakbeam
At this point I tried a few different methods, from coin pushers to RFID, but break beam sensors that break when the token slides down a clear ramp seemed like the best method.
Yes, this means that every building needs a slide now!
IR light sensors over I2C
The breakbeams ended up not working because the acryllic material we wanted to use was too transparent for the particular beam sensors we wanted. That, and we couldn't guarantee a certain speed for the token, so sometimes they would move so quickly the cheap beam breakers we got wouldn't sense it.
We instead decided to use a more sophisticated IR light sensor used in gesture recognition.
This more sophisticated sensor communicates over I2C, so in order to handle our 6 different buildings we needed to use a multiplexor.
After we got the multiplexor working separate from the table, it was time to try it with the physical table and intended layout.
We needed to adjust the thresholds for each of the sensors, and because our USB cable for the Arduino was so short, I had to do so from under the table.
Proof of Concept
With that multiplexor working, and our little models painted, we could finally test our proof of concept.
First version shown here uses BLE to communicate sensor data to TouchDesigner, but we had a lot of difficulties with interference in the space. Ideally we would use web sockets and use that as an opportunity to record the data to somewhere like Firebase.
Showcase
We showed our work at the 2023 ITP Spring Show and got a great response from viewers who voted.